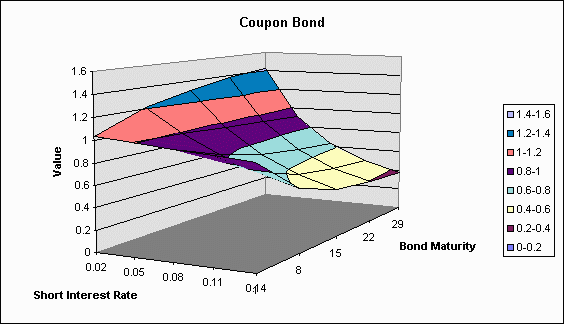
To study security values and risk measures as they relate to various market conditions and security parameters, 3-D graphs can be created quickly and easily with VC Graph, run through Excel. This tool allows the user to choose a range of values for each of two input values for a selected security or portfolio, and creates a graph showing the effect of these input values on the chosen Z-axis, which can be the value or a risk measure. The graph below shows, for a coupon bond, the relationships between interest rate level, bond maturity and bond value.

webmaster@valuecalc.com

